1 方法1
1
2
3
4
5
6
7
8
9
10
11
12
13
14
15
16
17
18
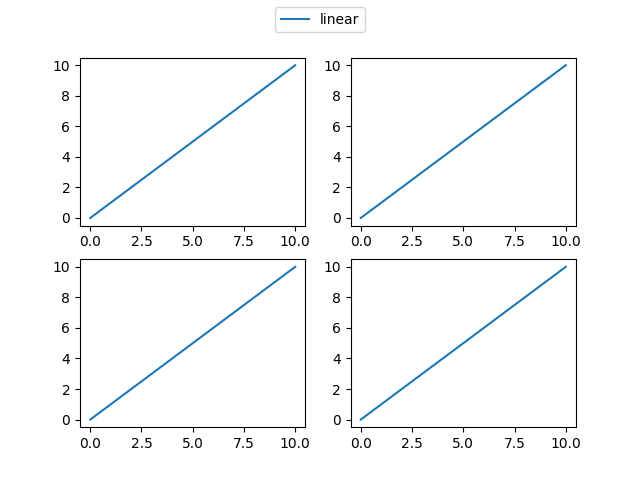
| import matplotlib.pyplot as plt
fig = plt.figure()
axes = fig.subplots(nrows=2, ncols=2)
axess = []
for ax in fig.axes:
axess.append(ax)
axess[0].plot([0, 10], [0, 10], label='linear')
axess[1].plot([0, 10], [0, 10], label='linear')
axess[2].plot([0, 10], [0, 10], label='linear')
axess[3].plot([0, 10], [0, 10], label='linear')
lines, labels = fig.axes[-1].get_legend_handles_labels()
fig.legend(lines, labels, loc='upper center')
plt.show()
|
2 方法2
1
2
3
4
5
6
7
8
9
10
11
12
13
14
15
16
17
18
19
20
21
22
23
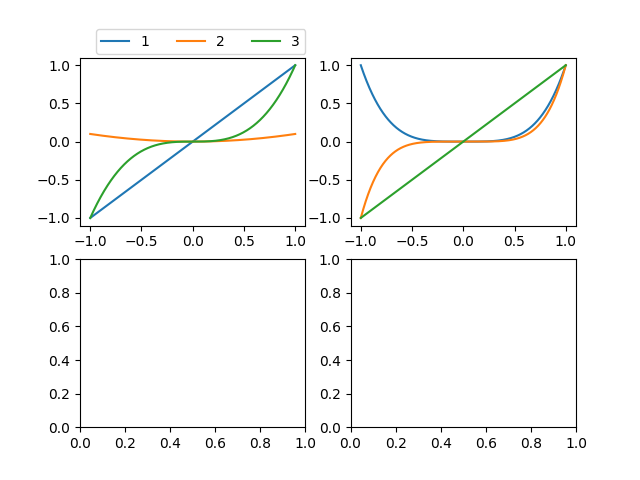
| import numpy as np
import matplotlib.pyplot as plt
x = np.linspace(-1, 1, 1000)
y1 = x
y2 = 0.1 * x ** 2
y3 = x ** 3
y4 = x ** 4
y5 = x ** 5
fig, grid = plt.subplots(nrows=2, ncols=2)
ax1 = plt.subplot(221)
ax1.plot(x, y1, label='1')
ax1.plot(x, y2, label='2')
ax1.plot(x, y3, label='3')
ax2 = plt.subplot(222)
ax2.plot(x, y4, label='4')
ax2.plot(x, y5, label='5')
ax2.plot(x, y1, label='1')
ax1.legend(bbox_to_anchor=(0., 1.02, 1., .102), loc=4, ncol=5, borderaxespad=0.)
plt.show()
|
写在最后
欢迎大家关注鄙人的公众号【麦田里的守望者zhg】,让我们一起成长,谢谢。

 wechat
 alipay
 bitcoin