1
2
3
4
5
6
7
8
9
10
11
12
13
14
15
16
17
18
19
20
21
22
23
24
25
26
27
28
29
30
31
32
33
34
35
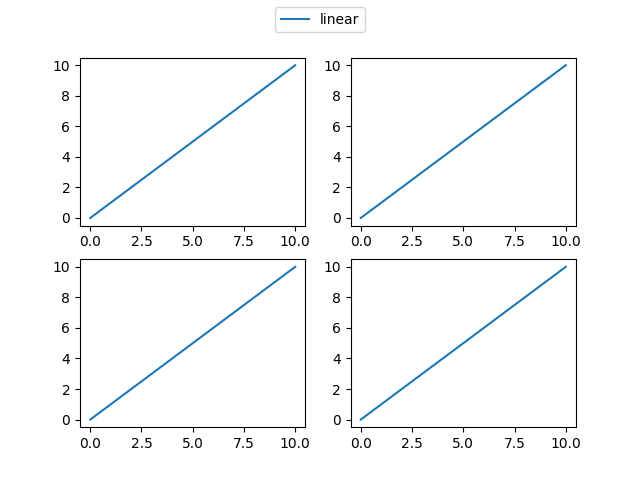
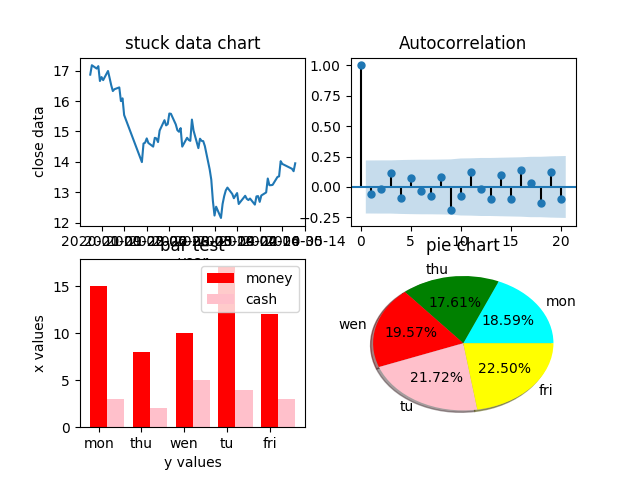
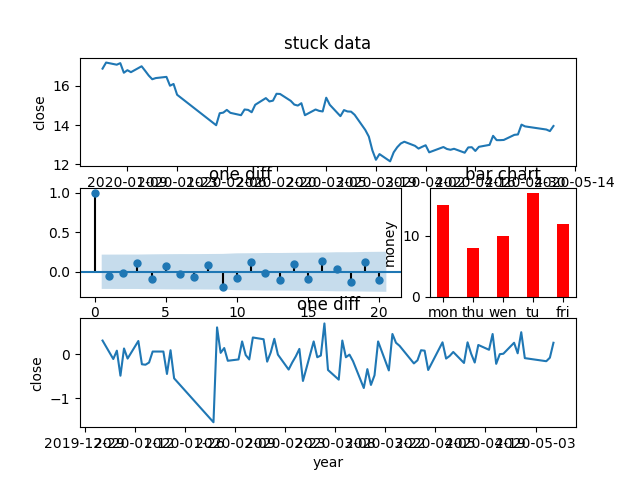
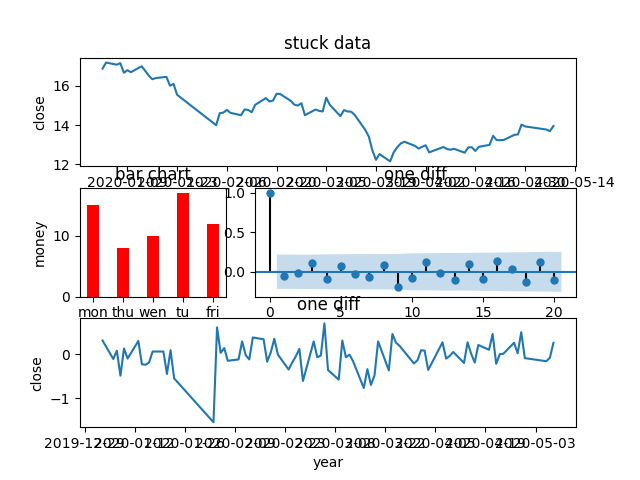
| def subplots():
fig, ax = plt.subplots(2,2)
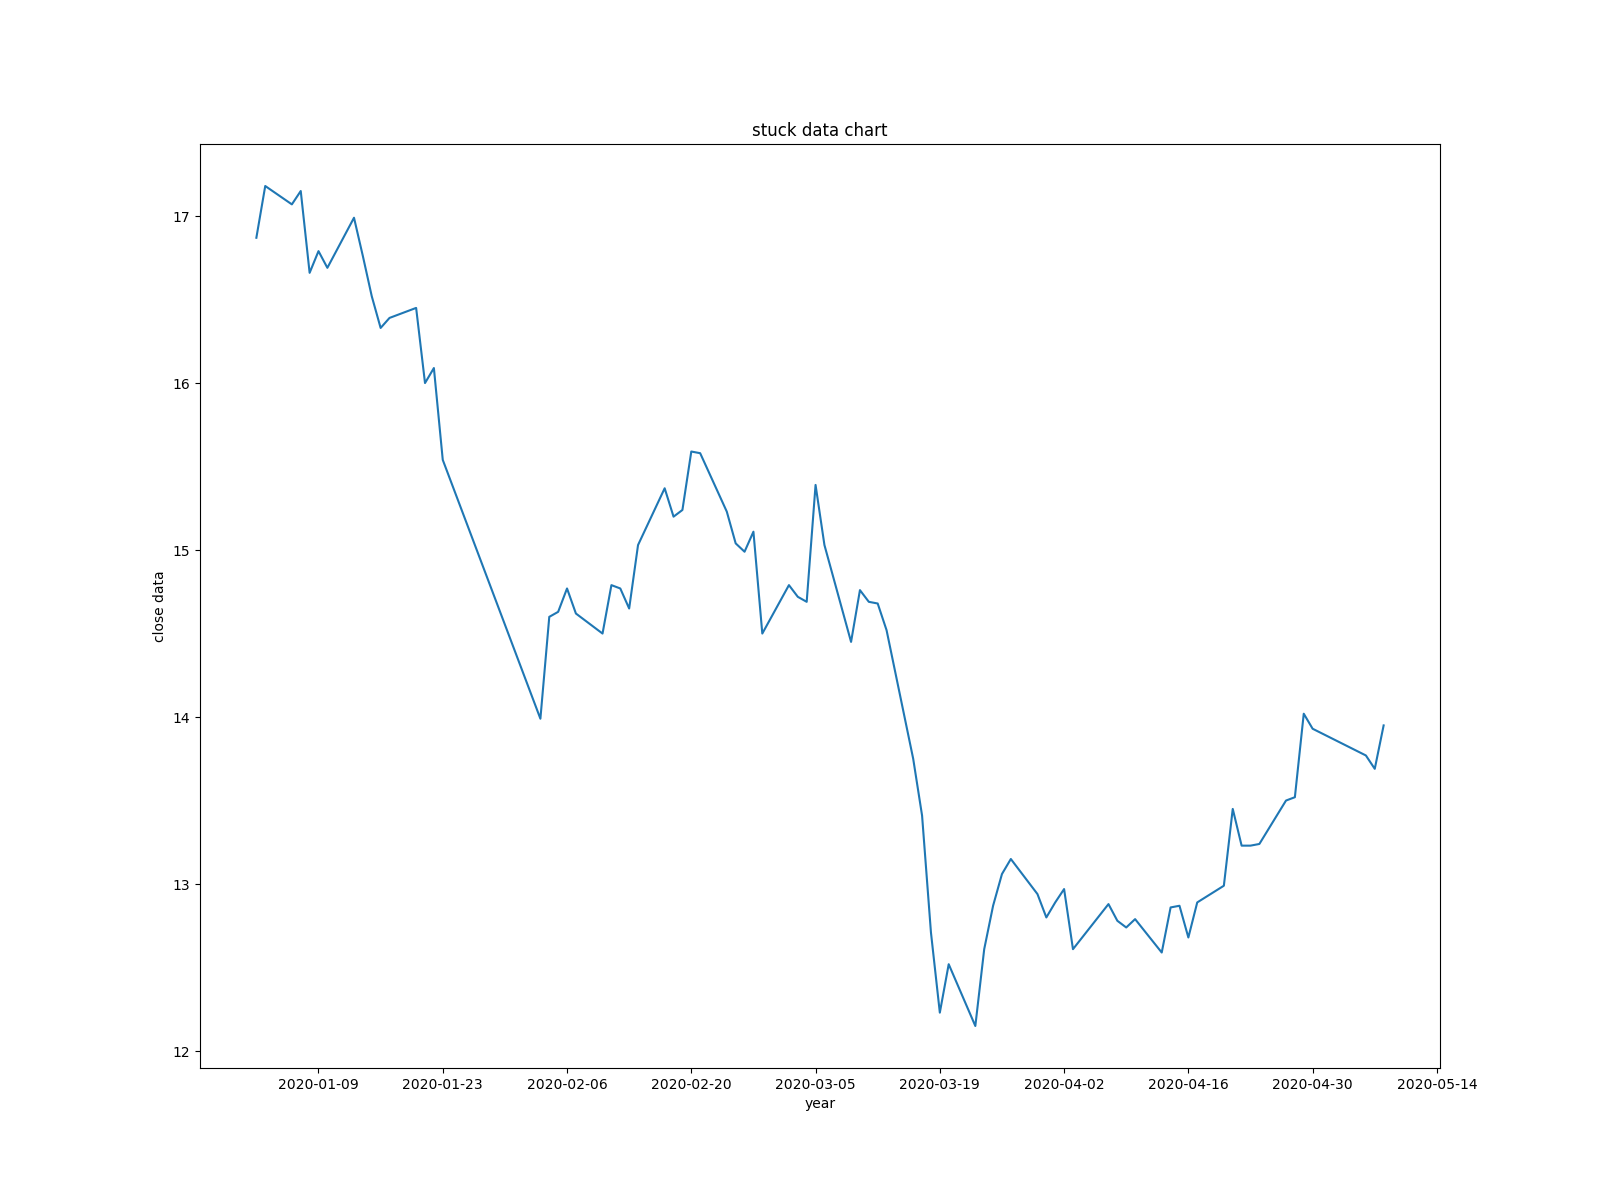
data = pd.read_csv("data/000001.SZ.csv")
x = pd.to_datetime([str(i) for i in data["trade_date"].values])
y = data["close"]
ax[0][0].plot(x, y)
ax[0,0].set_xlabel("year")
ax[0,0].set_ylabel("close")
ax[0,0].set_title("stuck data")
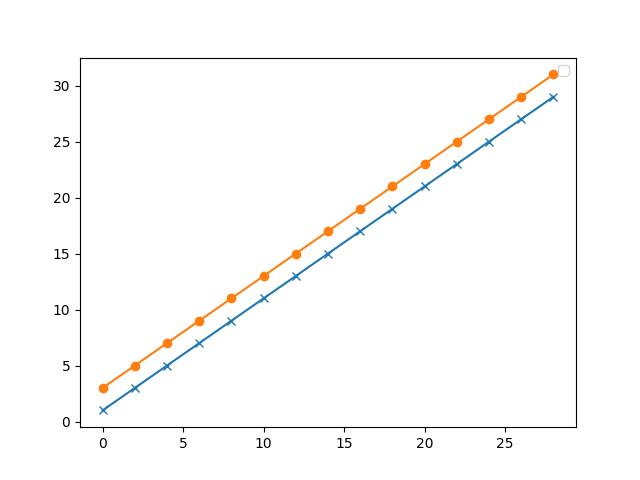
plot_acf(y.diff().dropna(),ax=ax[0,1])
ax[0,1].set_title("one diff")
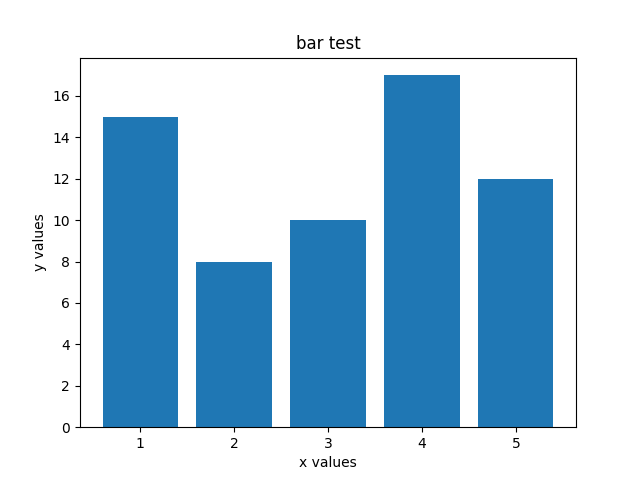
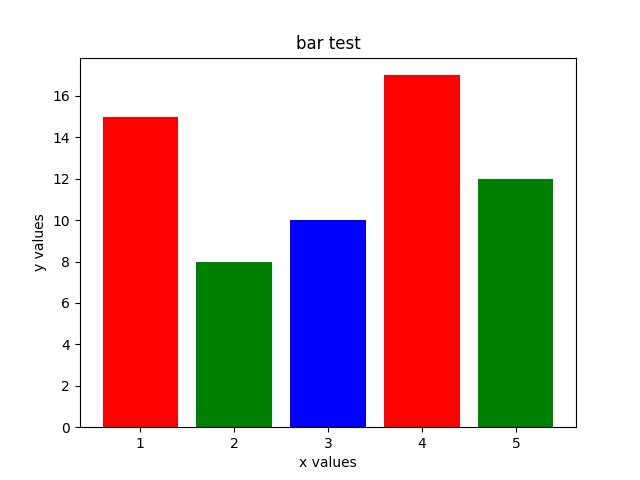
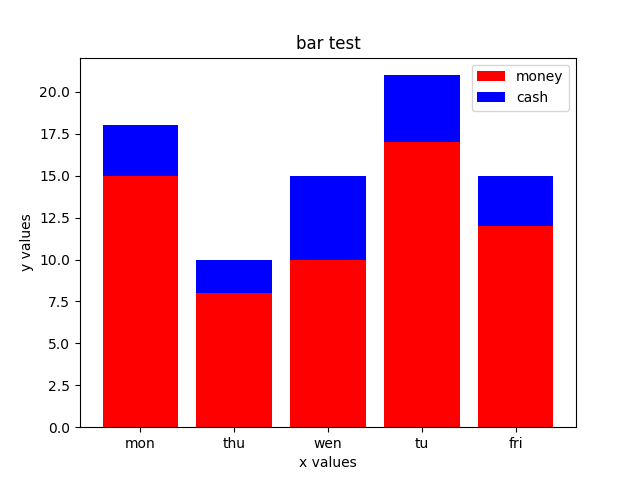
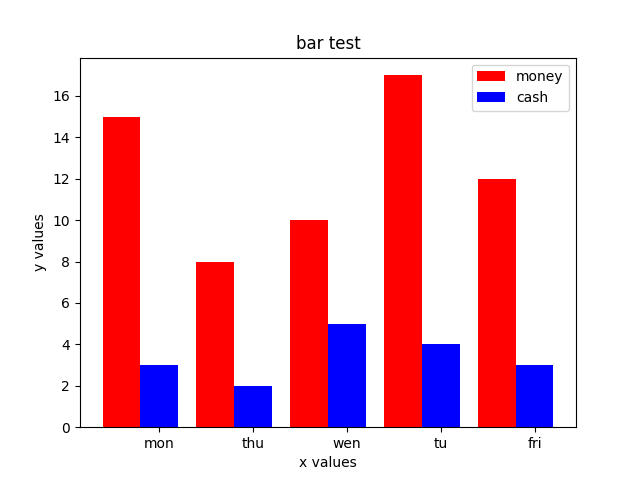
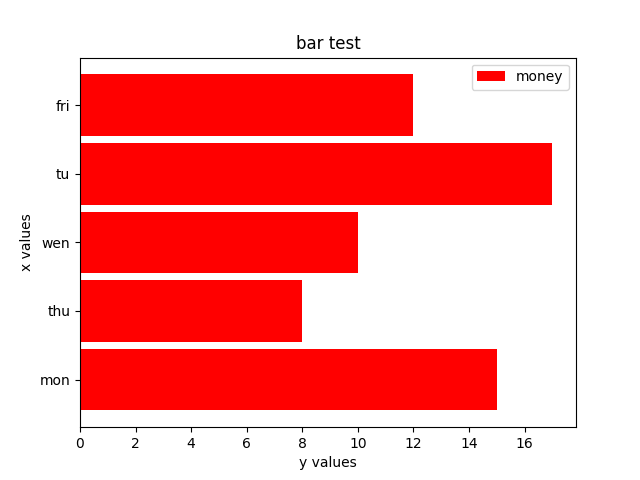
x = [1, 2, 3, 4, 5]
y = [15, 8, 10, 17, 12]
y2 = [3, 2, 5, 4, 3]
height = 0.4
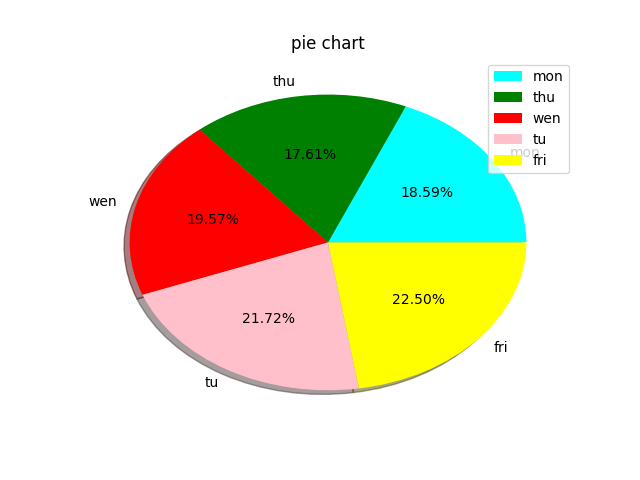
labels = ["mon", "thu", "wen", "tu", "fri"]
ax[1,0].bar(x, y, color="red", label="money", width=height, tick_label=labels)
for i in range(len(x)):
x[i] += height
ax[1,0].bar(x, y2, width=height, color="pink", label="cash")
ax[1,0].legend(loc="best")
ax[1,0].set_xlabel("y values")
ax[1,0].set_ylabel("x values")
ax[1,0].set_title("bar test")
y = [190, 180, 200, 222, 230]
color = ["cyan", "green", "red", "pink", "yellow"]
ax[1,1].pie(y, labels=labels, colors=color, shadow=True, autopct="%1.2f%%")
ax[1,1].set_title("pie chart")
savefig("img/subplots.png")
plt.show()
|


 wechat
 alipay
 bitcoin