1 Annoate
关于annotate更多的参数解释可以查看官方文档的注释内容,写的很全面,这里给出几个常用的参数用法,能够更好的掌握annotate的用法。
主要的参数:
text : str
The text of the annotation. s is a deprecated synonym for this parameter.
xy : (float, float)
The point (x,y) to annotate.
xytext : (float, float), optional
The position (x,y) to place the text at. If None, defaults to xy.
1 | import numpy as np |
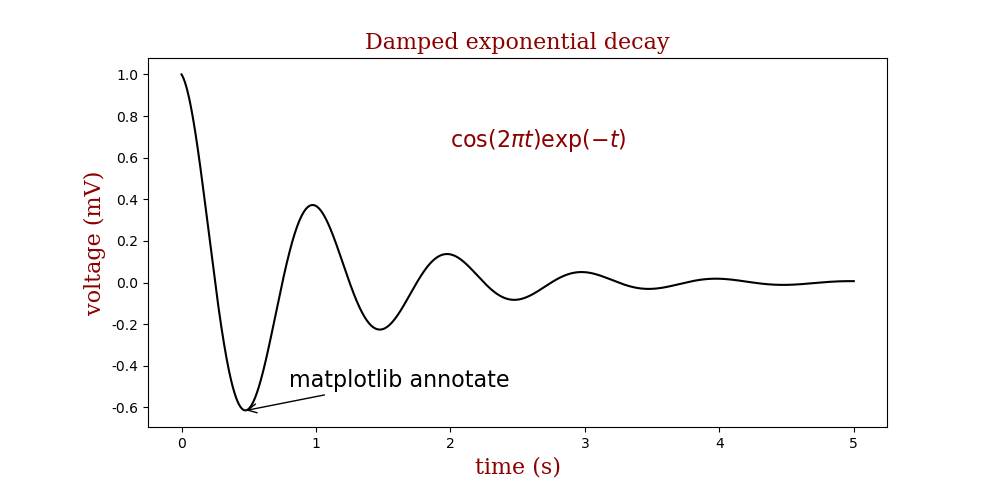
最终结果如下:
写在最后
欢迎大家关注鄙人的公众号【麦田里的守望者zhg】,让我们一起成长,谢谢。
All articles in this blog are licensed under CC BY-NC-SA 4.0 unless stating additionally.
 wechat
 alipay
 bitcoin
Related Articles


Comment